
A simple harvest control rule that sets fishing mortality (F) to a fixed target value regardless of stock status or other indicators.
Arguments
- stk
The 'oem' observation or SA estimation, an FLStock object.
- ftrg
The target fishing mortality value, numeric or FLQuant. If numeric, the value is replicated across all iterations and management years.
- ages
A vector of length 2 specifying the minimum and maximum ages over which F is averaged (fbar range), numeric. Defaults to minfbar and maxfbar from the stk FLStock range.
- args
A list containing dimensionality arguments, passed on by mp(). Must include elements: ay (advice year), it (number of iterations), mys (management years vector).
- tracking
An FLQuant used for tracking indicators, intermediate values, and decisions during MP evaluation.
Details
This HCR implements a constant fishing mortality strategy where the target F is directly applied. The function is useful for testing fixed harvest strategies or as a baseline reference in MSE comparisons. The target F can be specified as either a single numeric value (applied across all iterations and years) or as an FLQuant object with possible year and iteration structure.
Examples
# Example dataset
data(plesim)
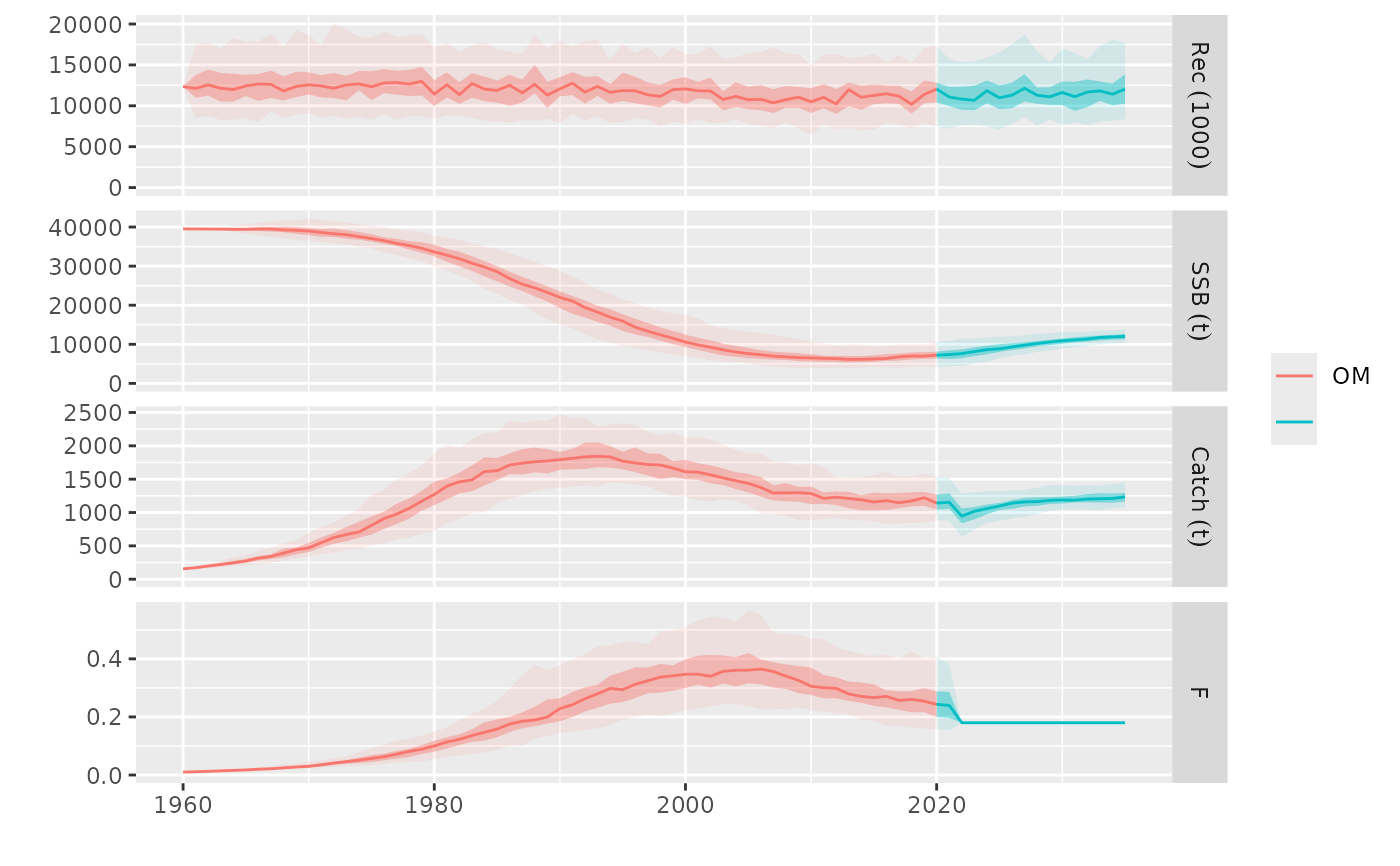
# Sets up an mpCtrl for fixed F at Fmsy
ctrl <- mpCtrl(est = mseCtrl(method=perfect.sa),
hcr = mseCtrl(method=fixedF.hcr, args=list(ftrg=0.18)))
# Runs mp between 2021 and 2035
run <- mp(om, control=ctrl, args=list(iy=2021, fy=2035))
#> 2021 - 2022 - 2023 - 2024 - 2025 - 2026 - 2027 - 2028 - 2029 - 2030 - 2031 - 2032 - 2033 - 2034 -
# Plot results
plot(om, run)
 # Check output
fbar(run)
#> An object of class "FLQuant"
#> iters: 100
#>
#> , , unit = unique, season = all, area = unique
#>
#> year
#> age 2020 2021 2022 2023
#> all 0.243(8.48e-02) 0.240(8.62e-02) 0.180(4.12e-17) 0.180(4.12e-17)
#> year
#> age 2024 2025 2026 2027
#> all 0.180(0.00e+00) 0.180(2.06e-17) 0.180(0.00e+00) 0.180(0.00e+00)
#> year
#> age 2028 2029 2030 2031
#> all 0.180(0.00e+00) 0.180(0.00e+00) 0.180(0.00e+00) 0.180(0.00e+00)
#> year
#> age 2032 2033 2034 2035
#> all 0.180(0.00e+00) 0.180(0.00e+00) 0.180(0.00e+00) 0.180(0.00e+00)
#>
#> units: f
# Using FLQuant for time-varying F
ftrg_var <- FLQuant(seq(0.1, 0.3, length=10), dimnames=list(year=2021:2030))
ctrl2 <- mpCtrl(est = mseCtrl(method=perfect.sa),
hcr = mseCtrl(method=fixedF.hcr, args=list(ftrg=ftrg_var)))
# Example using function directly
fixedF.hcr(stock(om), ftrg=0.13, args=list(ay=2017, it=100,
mys=2018:2020), tracking=FLQuant())
#> $ctrl
#> An object of class "fwdControl"
#> (step) year quant min value max
#> 1 2018 fbar NA 0.130 NA
#> 2 2019 fbar NA 0.130 NA
#> 3 2020 fbar NA 0.130 NA
#> iters: 100
#>
#>
#> $tracking
#> An object of class "FLQuant"
#> , , unit = unique, season = all, area = unique
#>
#> year
#> quant 1
#> all NA
#>
#> units: NA
#>
# Check output
fbar(run)
#> An object of class "FLQuant"
#> iters: 100
#>
#> , , unit = unique, season = all, area = unique
#>
#> year
#> age 2020 2021 2022 2023
#> all 0.243(8.48e-02) 0.240(8.62e-02) 0.180(4.12e-17) 0.180(4.12e-17)
#> year
#> age 2024 2025 2026 2027
#> all 0.180(0.00e+00) 0.180(2.06e-17) 0.180(0.00e+00) 0.180(0.00e+00)
#> year
#> age 2028 2029 2030 2031
#> all 0.180(0.00e+00) 0.180(0.00e+00) 0.180(0.00e+00) 0.180(0.00e+00)
#> year
#> age 2032 2033 2034 2035
#> all 0.180(0.00e+00) 0.180(0.00e+00) 0.180(0.00e+00) 0.180(0.00e+00)
#>
#> units: f
# Using FLQuant for time-varying F
ftrg_var <- FLQuant(seq(0.1, 0.3, length=10), dimnames=list(year=2021:2030))
ctrl2 <- mpCtrl(est = mseCtrl(method=perfect.sa),
hcr = mseCtrl(method=fixedF.hcr, args=list(ftrg=ftrg_var)))
# Example using function directly
fixedF.hcr(stock(om), ftrg=0.13, args=list(ay=2017, it=100,
mys=2018:2020), tracking=FLQuant())
#> $ctrl
#> An object of class "fwdControl"
#> (step) year quant min value max
#> 1 2018 fbar NA 0.130 NA
#> 2 2019 fbar NA 0.130 NA
#> 3 2020 fbar NA 0.130 NA
#> iters: 100
#>
#>
#> $tracking
#> An object of class "FLQuant"
#> , , unit = unique, season = all, area = unique
#>
#> year
#> quant 1
#> all NA
#>
#> units: NA
#>