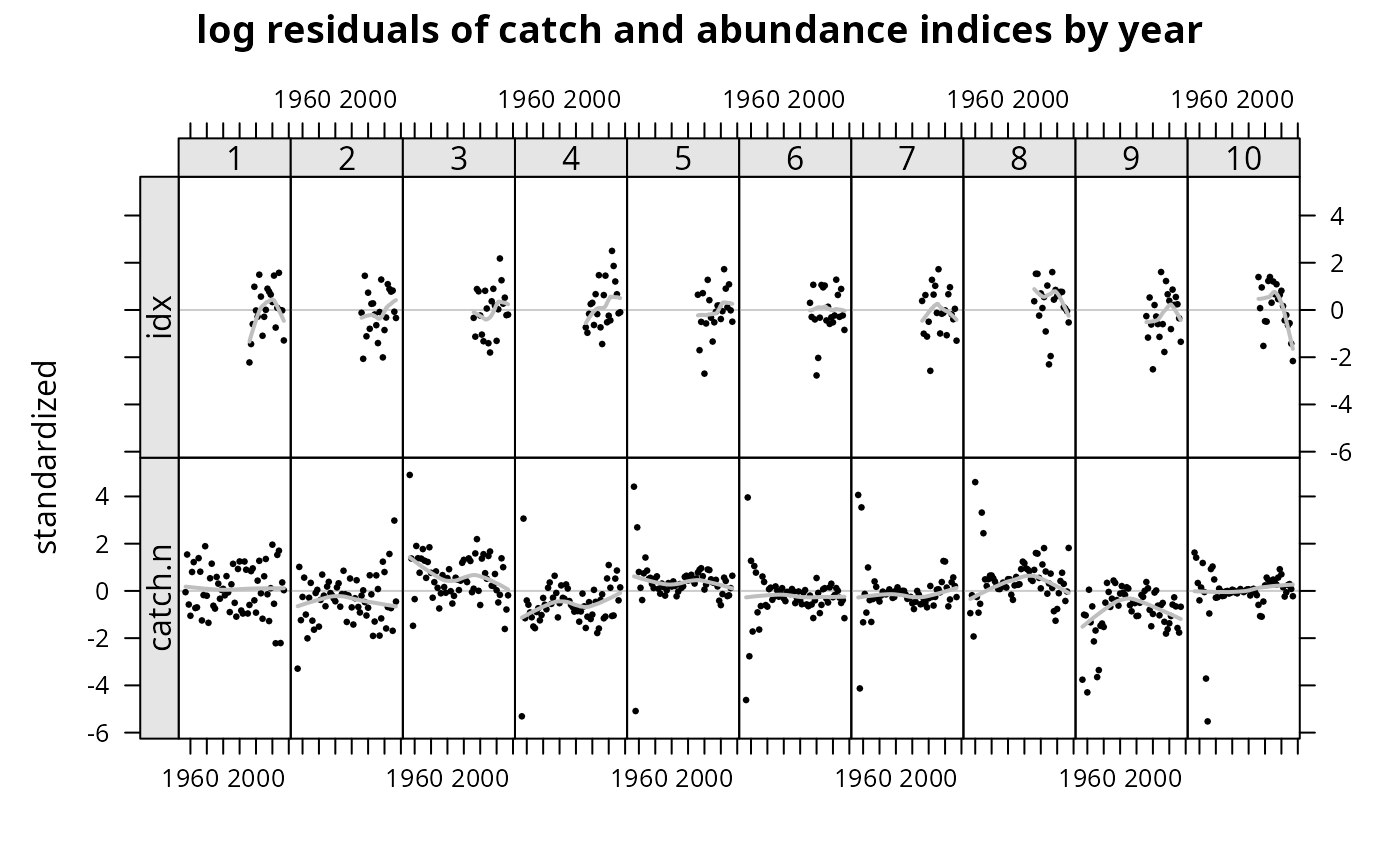
Plot of standardized log residuals
plot-res.RdMethod to produce scatterplots of standardized residuals
# S4 method for class 'a4aFitResiduals,missing'
plot(x, y = missing, auxline = "smooth", by = "year", ...)
Arguments
- x
an
a4aFitResidualsobject with the standardized residuals- y
ignored
- auxline
a string defining the type of line to be added, by default uses 'smooth', a common alternative is to use 'r', a regression, or leave it empty ”
- by
a string defining the type of plot to be depicted. At the moment accepts only 'age', the default, or 'year'.
- ...
additional argument list that might never be used
Value
a plot with stardardized log residuals
Examples
data(ple4)
data(ple4.index)
obj <- sca(ple4, FLIndices(ple4.index))
#> Warning: *** ~te(age, year, k = c(6, 30), bs = "tp") + s(age, k = 6) has 4 too many parameter(s)!!
#>     i will remove the redundant ones:
#> 	s(age).2
#> 	s(age).3
#> 	s(age).4
#> 	s(age).5
flqs <- residuals(obj, ple4, FLIndices(idx=ple4.index))
plot(flqs)