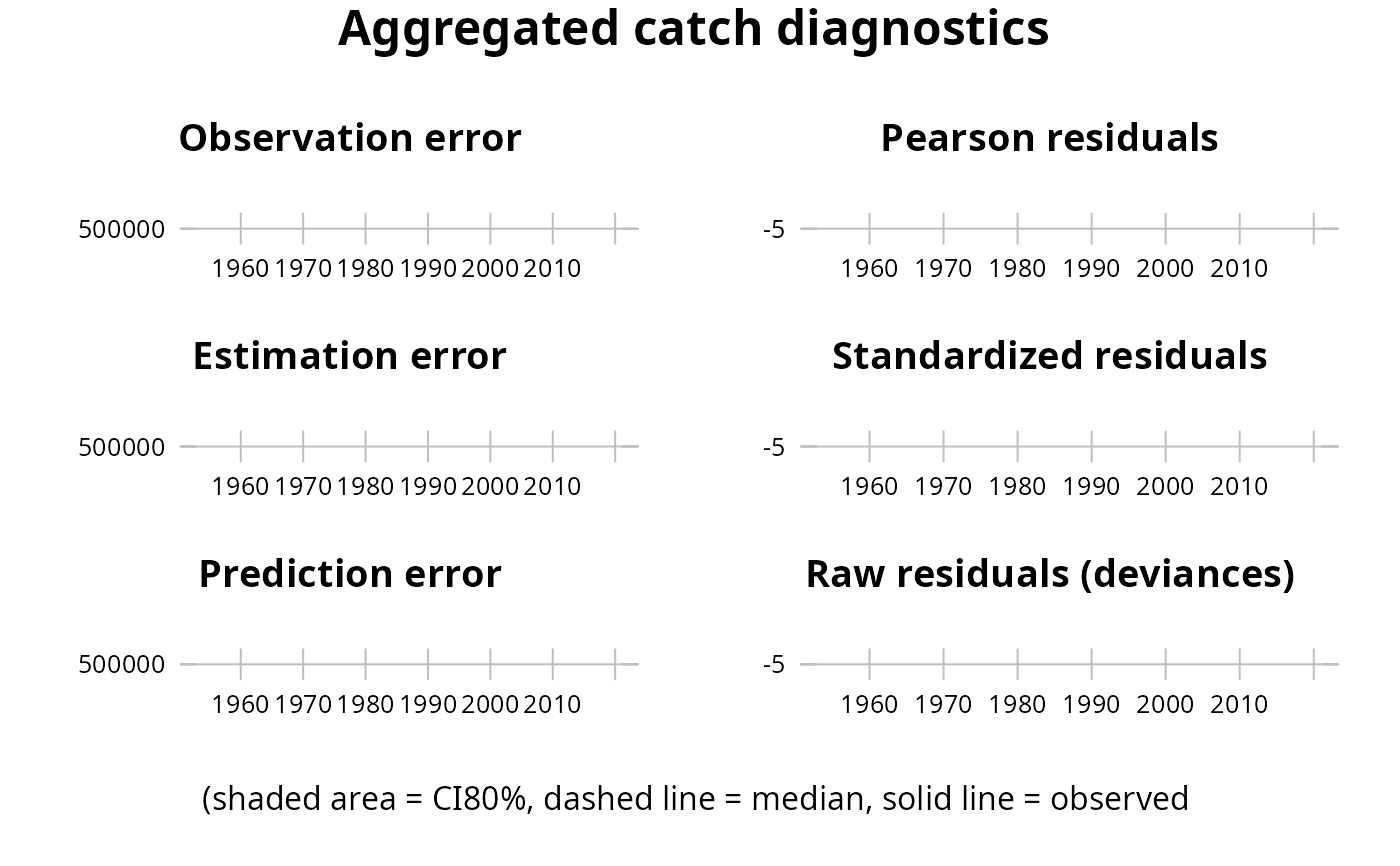
Plot of aggregated catch standardized log residuals
plot-catch.RdMethod to produce scatterplots of aggregated catch residuals
Arguments
Value
a plot with stardardized log residuals
Examples
data(ple4)
data(ple4.index)
fit <- sca(ple4, ple4.index)
#> Warning: *** ~te(age, year, k = c(6, 30), bs = "tp") + s(age, k = 6) has 4 too many parameter(s)!!
#>     i will remove the redundant ones:
#> 	s(age).2
#> 	s(age).3
#> 	s(age).4
#> 	s(age).5
flqs <- computeCatchDiagnostics(fit, ple4)
plot(flqs)